Image Details
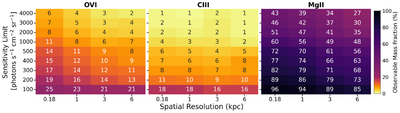
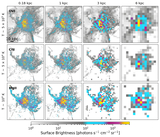
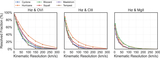
Caption: Figure 5.
Observable CGM mass fraction as a function of spatial resolution (x-axis) and surface brightness sensitivity (y-axis). The spatial resolutions of 0.18, 1, 3, and 6 kpc, correspond at z = 0.5 (z = 0, 10 Mpc) to ∼ 0.04 (5.6), 0.16 (20), 0.5 (61), and 1 (120) arcsec, respectively. These maps are for three representative emission lines, averaged over six FOGGIE halos and for edge-on projections (see Appendix B for maps of all eight ions’ face-on and edge-on results). Each cell shows the percentage of total CGM mass detectable above the given sensitivity limit at the specified resolution, with values color coded and overlaid. As expected, observability decreases with lower sensitivity and coarser resolution, though sensitivity plays a stronger role: at fixed resolution, increasing the detection threshold from 100 to 500 reduces the detectable mass by more than 50% in several ions. Achieving high sensitivity is critical for maximizing CGM detection, particularly for tracing diffuse, highly ionized gas.
Other Images in This Article
Show More
Copyright and Terms & Conditions
© 2026. The Author(s). Published by the American Astronomical Society.