Image Details
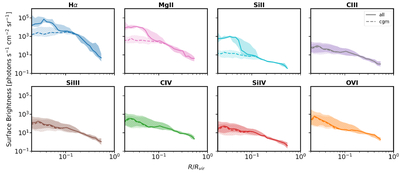
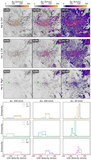
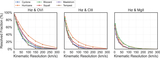
Caption: Figure 3.
Radial surface brightness profiles for eight ions across all FOGGIE halos (face-on, 0.18 kpc resolution). Solid lines show median profiles including all gas; dashed lines show CGM-only emission after H I disk removal. Shaded regions indicate the range of halo-to-halo variation. Most ions follow power-law profiles, while Hα, Mg II, and Si II show a break in slope around 0.1 Rvir—reflecting a transition from disk to CGM-dominated emission. CGM-only profiles flatten at small radii for low-ionization species.
Other Images in This Article
Show More
Copyright and Terms & Conditions
© 2026. The Author(s). Published by the American Astronomical Society.
Copyright ©
2026 Astronomy Image Explorer. All Rights Reserved.