Image Details
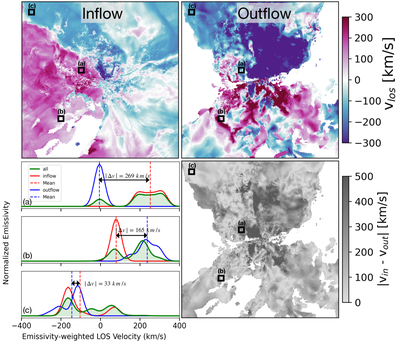
Caption: Figure 10.
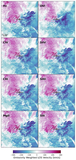
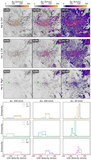
Top panels: emissivity-weighted line-of-sight velocity maps for O VI in the Maelstrom halo (edge-on view), showing only gas classified as inflow (with a center-directed vrad ≤ −100 km s−1 in the frame of the galaxy’s center of mass; left panel) or outflow (vrad ≥ 200 km s−1; right panel), based on 3D radial velocities. Bottom-left panels (a), (b), and (c): emissivity-weighted line-of-sight velocity profiles for three selected sightlines (black squares labeled (a)–(c) in the top and bottom maps), showing distributions for all gas (green), inflowing gas (red), and outflowing gas (blue). Dashed lines mark the emissivity-weighted mean velocity of each component. The labeled ∣Δv∣ indicates the absolute difference between the inflow and outflow mean velocities along each sightline. Bottom right: grayscale map showing the absolute difference in emissivity-weighted projected velocity between inflow and outflow at each pixel. This figure illustrates the kinematic signatures of inflowing and outflowing gas, with velocity separations ranging from tens to hundreds of km s−1.
Other Images in This Article
Show More
Copyright and Terms & Conditions
© 2026. The Author(s). Published by the American Astronomical Society.