

Image Details
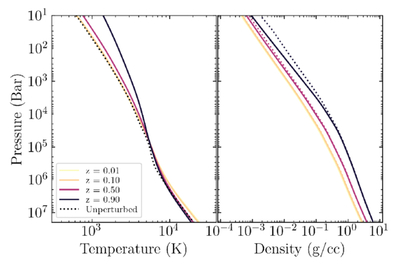
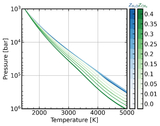
Caption: Figure 3.
Adiabatic T–P profiles (left) and corresponding pressure–density profiles (right) used for the water/H/He mixtures in our interior models at various compositions. We compare this approach against the approximation that the T–P profile is the same as for Z = 0 (pure H/He, dotted lines). The densities only differ significantly at low pressures, but the temperature gradient is significantly different by Z = 0.5, which affects the thermal evolution.
Other Images in This Article
Show More
Copyright and Terms & Conditions
© 2026. The Author(s). Published by the American Astronomical Society.

Copyright ©
2026 Astronomy Image Explorer. All Rights Reserved.
