

Image Details
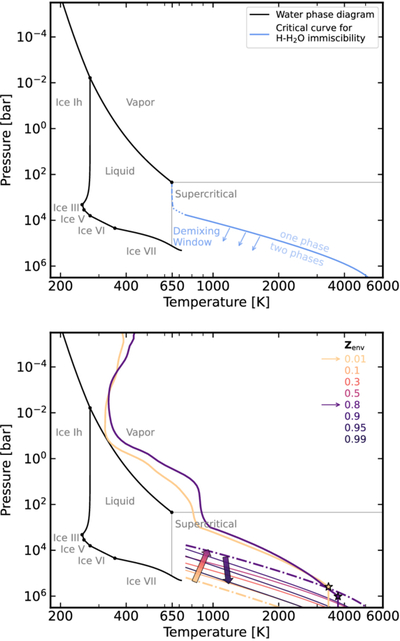
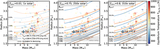
Caption: Figure 1.
Illustration of the demixing window concept. Top panel: water phase diagram (black lines) with labeled regions; the critical curve (blue) indicates the highest temperature for single-phase H-H2O mixing, compiled from low-pressure data (dashed, T. M. Seward & E. U. Franck 1981) and high-pressure data (solid, A. Gupta et al. 2025), with interpolation (dotted). Envelope T–P profiles below the blue line can experience demixing for some compositions. Bottom panel: demixing window at different metallicities. High-pressure H-H2O coexistence curves (colored), for various envelope metallicities Zenv, show that the window for immiscible conditions is maximal for metallicities near Z ∼ 0.8, but recedes for lower and higher metallicities (illustrated by colored arrows). Example T–P profiles for a 5.1 M⊕ planet at Teq = 360 K, with an envelope mass fraction of 30% and a metallicity of either 0.01 (1× solar; orange) or 0.8 (∼300× solar; purple), are shown, with dashed–dotted linestyles for the corresponding coexistence curves. At low metallicity, the envelope profile (down to the mantle–envelope boundary, star marker) does not intersect the coexistence curve, but for Zenv = 0.8, it does, implying that under stable conditions, the upper-atmosphere metallicity would be lower than that of the bulk envelope. Note that due to the low water abundance (VMR ∼ 10−3) in the Z = 0.01 model, it would not experience water condensation despite its proximity to the pure-water condensation curve.
Other Images in This Article
Show More
Copyright and Terms & Conditions
© 2026. The Author(s). Published by the American Astronomical Society.

