

Image Details
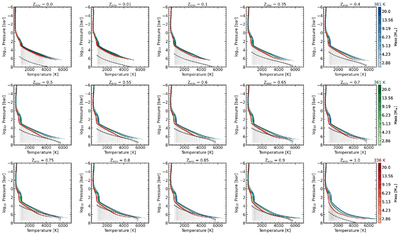
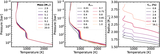
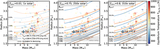
Caption: Figure B1.
T–P profile for the envelope (colors) and interior (dotted, gray) across all conditions in the grid, compared to the coexistence curves (median is black dashed, and 95% C.I. shown as gray shading), for different envelope metallicities (labeled for each panel). The color shadings encode the planet mass for the three temperatures explored in the grid (shades of blue for Teq = 381 K, green for Teq = 361 K, red for Teq = 336 K). The vertical and horizontal span in T–P space is kept constant throughout all panels to illustrate the compositional dependence of the demixing window.
Other Images in This Article
Show More
Copyright and Terms & Conditions
© 2026. The Author(s). Published by the American Astronomical Society.

Copyright ©
2026 Astronomy Image Explorer. All Rights Reserved.
