Image Details
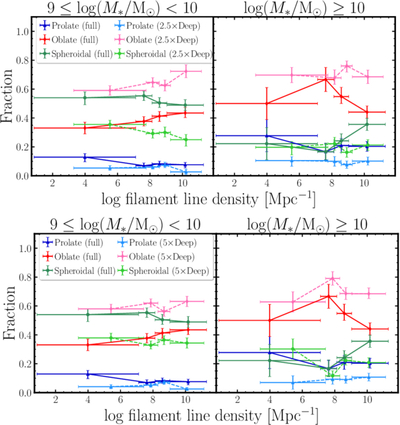
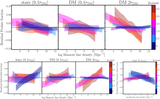
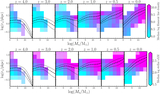
Caption: Figure 13.
The dependence of 3D morphological fractions (prolate, oblate, and spheroidal) on nearest filament density at z = 1. The mass-complete (“full”) sample is represented by darker colors and solid lines, while the mock samples are represented by lighter colors and dashed lines—the top row is for the 2.5× HLWAS Spec-Deep sample, while the bottom row is for the 5× HLWAS Spec-Deep sample. The left and right columns are for lower and higher stellar mass bins, respectively. Deep spectroscopy can qualitatively, but not quantitatively, recover the true cosmic web dependence of galaxy morphologies.
Other Images in This Article
Show More
Copyright and Terms & Conditions
© 2026. The Author(s). Published by the American Astronomical Society.
Copyright ©
2026 Astronomy Image Explorer. All Rights Reserved.