Image Details
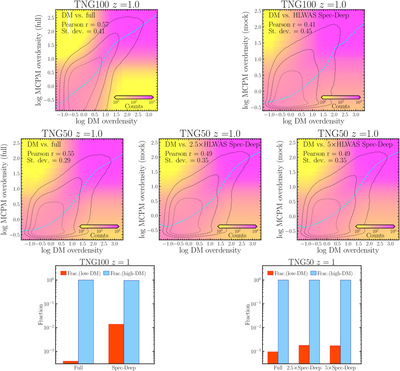
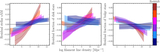
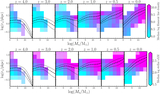
Caption: Figure 12.
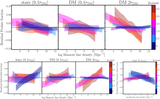
Quantitative comparisons of the cosmic web from different galaxy samples at z = 1. Top row: 2D histograms comparing DM matter overdensities (x-axis) with MCPM overdensities (y-axis) at the same physical location for the “full” ﹩{\mathrm{log}}\,({M}_{* }/{M}_{\odot })\,\geqslant \,8﹩ sample (left) and the mock HLWAS Spec-Deep sample (right) in TNG100. Dotted, dashed–dotted, and dashed black contours enclose 50%, 75%, and 90% of the distributions, respectively. The cyan dashed curves represent the median relationship and Pearson correlation coefficients and median standard deviation are indicated as well. Middle row: the same comparison for three samples in TNG50: ﹩{\mathrm{log}}\,({M}_{* }/{M}_{\odot })\,\geqslant \,8﹩ (left), HLWAS 2.5×Spec-Deep (middle), and 5×Spec-Deep (right). Bottom row: the fraction of filament segments located in very low (bottom 25%) DM overdensity regions (orange-red) and high (top 50%) overdensity regions (light blue) for the full and mock samples in TNG100 (left) and TNG50 (right).
Other Images in This Article
Show More
Copyright and Terms & Conditions
© 2026. The Author(s). Published by the American Astronomical Society.