Image Details
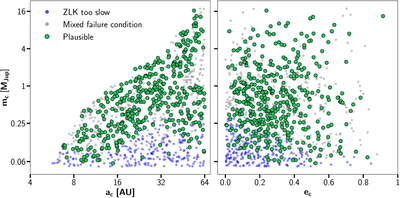
Caption: Figure 5.
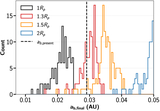
ZLK simulation results in ac−mc (left) and mc−ec space (right). Each point represents one companion configuration tested across 18 different initial conditions. Blue points indicate companion configurations where ZLK migration is too slow (tHN > 10 Gyr) for all 18 initial conditions. Gray points show mixed failure conditions where ZLK migration either is too slow (tHN > 10 Gyr), is too fast (tHN < 1 Gyr), or causes GJ 436 b to reach the Roche limit (ab < aR). Green points represent plausible configurations for which at least one of the 18 suites reproduces the present-day orbit. For each plausible companion configuration, only one to three of the 18 initial condition suites plausibly reproduce the present-day orbit.
Other Images in This Article
Copyright and Terms & Conditions
© 2026. The Author(s). Published by the American Astronomical Society.