Image Details
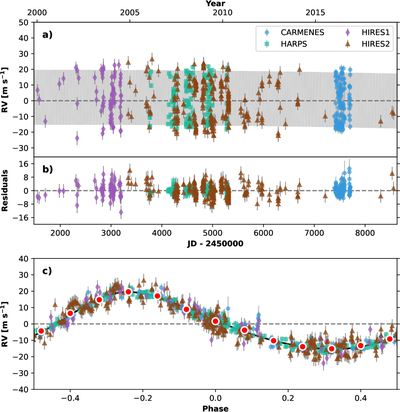
Caption: Figure 1.
RV measurements and our best-fitting model of the GJ 436 system. Panel (a) shows the RV data with the best-fit model over the 19 yr baseline. Panel (b) displays the RV residuals. Panel (c) presents the phased data and model based on the best-fit orbital parameters. Each instrument is plotted with a different color, and the Keplerian model is shown in black.
Other Images in This Article
Copyright and Terms & Conditions
© 2026. The Author(s). Published by the American Astronomical Society.
Copyright ©
2026 Astronomy Image Explorer. All Rights Reserved.