Image Details
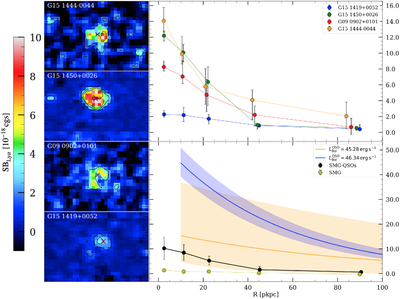
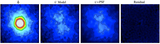
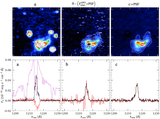
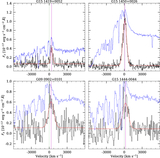
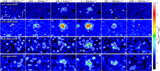
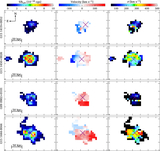
Caption: Figure 9.
Left: integrated Lyα SB maps within ±1500 km s−1 of the target redshift. From top to bottom, we present the brightest to faintest Lyα nebulae, respectively. Top right: individual SB profiles for G15 1419+0052, G15 1450+0026, G09 0902+0101, and G15 1444−0044, shown as blue, green, red, and orange squares, respectively. Error bars indicate the 25th−75th percentile range within each annulus. Bottom right: mean SMG–QSO SB profile (black dots) compared with results from previous studies. The best-fit power law for the faint (﹩{L}_{{\rm{Bol}}}^{{\rm{QSO}}}=45.28﹩) and the ﹩{L}_{{\rm{Bol}}}^{{\rm{QSO}}}=46.34﹩ QSO sample from J. González Lobos et al. (2026) are plotted as orange and blue lines, respectively. The shaded regions correspond to their 1σ uncertainty. The profile of the SMG from H24 is shown as gold circles.
Other Images in This Article
Copyright and Terms & Conditions
© 2026. The Author(s). Published by the American Astronomical Society.