Image Details
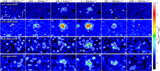
Caption: Figure 8.
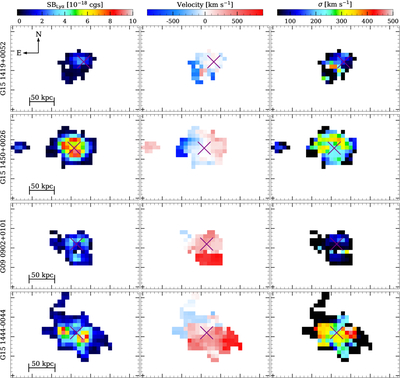
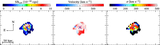
Moment maps of the extended Lyα emission surrounding the SMG–QSO composite systems. G15 1419+0052, G15 1450+0026, G09 0902+0101, G15 1444−0044 from top to bottom, and the Lyα SB, velocity, and dispersion maps from left to right. All targets share an equal color bar for their respective moment maps, which can be found at the top of each column. We provide a scale bar set to 50 kpc at zQSO (see Table 1) for each target, in the lower left corner of each moment 0 map.
Other Images in This Article
Copyright and Terms & Conditions
© 2026. The Author(s). Published by the American Astronomical Society.
Copyright ©
2026 Astronomy Image Explorer. All Rights Reserved.