Image Details
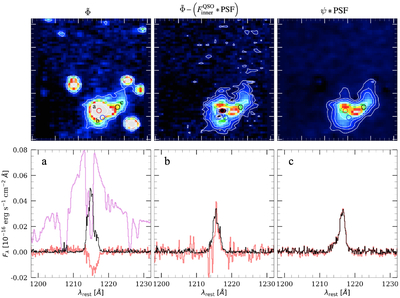
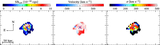
Caption: Figure 5.
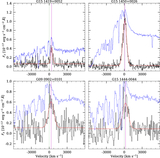
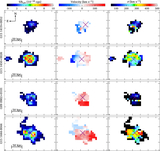
Top row: Lyα SB map integrated within a ±1500 km s−1 velocity window with respect to the redshift of QSO 1. Bottom row: integrated spectra extracted from the red (a), blue (b), and black (c) apertures shown in the top panels. The spectra captured from these apertures are shown from left to right, respectively. We plot the results from CubeCarve v1.0.0 and the direct approach method as black and red lines, respectively. We plot the original QSO spectrum as a magenta line in the bottom-left panel (scaled down by a factor of 10) as a reference. White contour lines correspond to SB values of 2.0, 4.0, 7.0, 14.0, and 20.0 × 10⁻¹⁸ cgs
Other Images in This Article
Copyright and Terms & Conditions
© 2026. The Author(s). Published by the American Astronomical Society.