Image Details
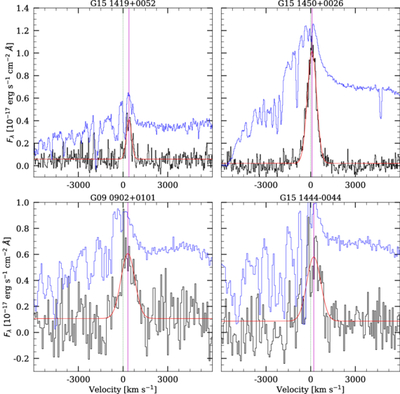
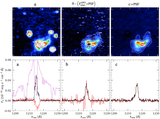
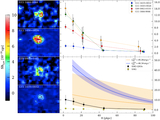
Caption: Figure 6.
Flux density for both the QSO and the Lyα nebula as a function of the velocity. For all panels, we plot the spectrum of the QSO (scaled down to make a comparison) and Lyα nebula for each SMG–QSO composite system as blue and black lines, respectively, and overlay the best-fit 1D Gaussian in red with its mean value shown as a vertical magenta line. The green dashed line corresponds to the Lyα line at the redshift of each galaxy.
Other Images in This Article
Copyright and Terms & Conditions
© 2026. The Author(s). Published by the American Astronomical Society.
Copyright ©
2026 Astronomy Image Explorer. All Rights Reserved.