Image Details
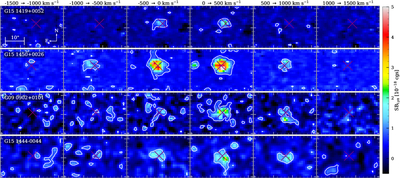
Caption: Figure 7.
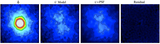
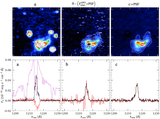
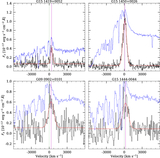
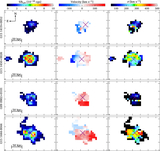
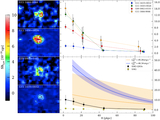
Lyα channel maps. We select a total velocity range of ±1500 km s−1. Each column corresponds to a narrow ≈500 km s−1 channel for each SMG–QSO, as denoted at the top of each column. The top two rows correspond to the KCWI targets, and the bottom two rows correspond to the MUSE targets. The white contour corresponds to S/N = 2. For presentation purposes, we convolve each channel map with a 2 × 2 Boxcar kernel. The purple X corresponds to the position of the QSO.
Other Images in This Article
Copyright and Terms & Conditions
© 2026. The Author(s). Published by the American Astronomical Society.
Copyright ©
2026 Astronomy Image Explorer. All Rights Reserved.