Image Details
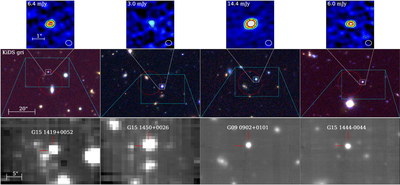
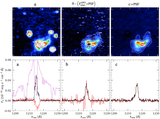
Caption: Figure 1.
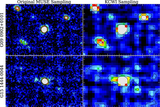
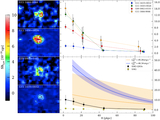
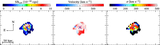
Finder chart for each SMG–QSO composite system. Middle panel: KiDS gri tricolor image of the field centered at the position of the Herschel 250 μm source. The red-dashed circle corresponds to its positional uncertainty (﹩12\mathop{.}\limits{^{\prime\prime} }5﹩). Top panel: We provide the ALMA 870 μm continuum maps of each Herschel-detected source. Each panel is ﹩4\mathop{.}\limits{^{\prime\prime} }\times 4\mathop{.}\limits{^{\prime\prime} }﹩, and we indicate its location relative to the KiDS image as a white box. Additionally, the ellipse in the lower-right corner represents the shape of the CLEAN beam. Bottom panel: We present the pseudo-g-band images of the field as seen through KCWI and MUSE.
Other Images in This Article
Copyright and Terms & Conditions
© 2026. The Author(s). Published by the American Astronomical Society.