Image Details
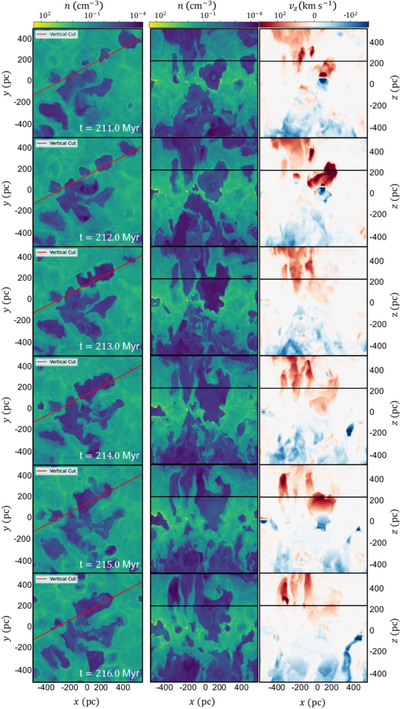
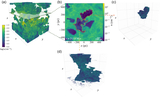
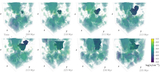
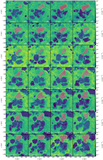
Caption: Figure 10.
Visualization of the vertical feature of density (n) and vz for superbubble SB 230. The left column shows a 2D density slice at z = 202 pc with a red line marking the chosen vertical cut to intersect the identified bubble. The middle column presents the cross-sectional density slices along that cut, which pass through SB 230, and the right column shows the corresponding vertical vz slices that capture the bubble’s dynamical evolution. We compare these slices with direct views of the isolated bubble to validate the algorithm’s selections. Applying this automated procedure across many bubbles enables robust statistical extraction and demonstrates that detection-based analysis reproduces the physical behavior obtained by manual inspection, supporting its use for the full sample.
Other Images in This Article
Show More
Copyright and Terms & Conditions
© 2026. The Author(s). Published by the American Astronomical Society.