Image Details
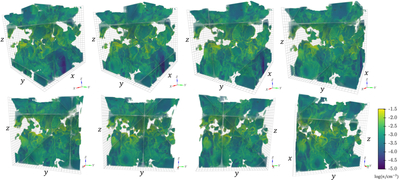
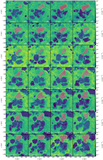
Caption: Figure 3.
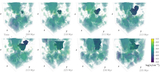
Visualization presenting 3D density cubes of hot gas extracted from the magnetohydrodynamic simulation dataset (A. S. Hill et al. 2018). The cubes are thresholded at T > 105.5 K to highlight hot gas structures at t = 209 Myr. The rotation around the z-axis provides different perspectives, offering a clearer view of the spatial distribution and morphology of these high-temperature regions.
Other Images in This Article
Show More
Copyright and Terms & Conditions
© 2026. The Author(s). Published by the American Astronomical Society.
Copyright ©
2026 Astronomy Image Explorer. All Rights Reserved.