Image Details
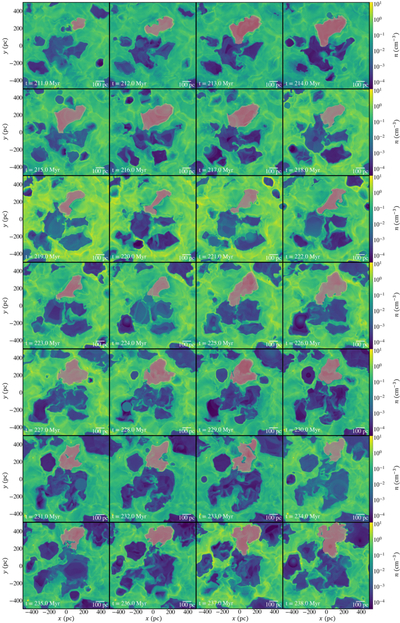
Caption: Figure 9.
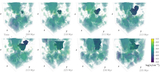
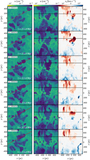
Density slice at z = 167 pc for SB 230 (masked in orange) at each timestep. This plot illustrates the evolution of the target bubble, starting as a distinct structure, temporarily connecting with a nearby formation at t = 213 Myr, and later detaching again at t = 219 Myr. This progression highlights the challenges of accurately tracing bubble morphology when relying solely on 2D observations.
Other Images in This Article
Show More
Copyright and Terms & Conditions
© 2026. The Author(s). Published by the American Astronomical Society.
Copyright ©
2026 Astronomy Image Explorer. All Rights Reserved.