Image Details
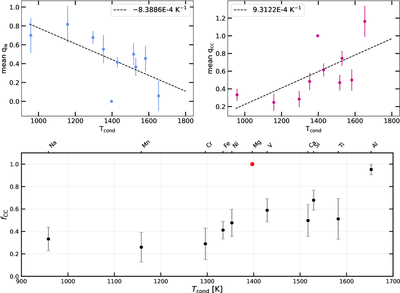
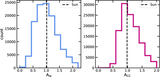
Caption: Figure 10.
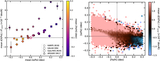
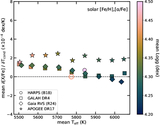
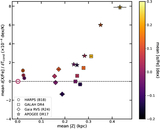
Top: mean qia (in blue, left) and qcc (in red, right) or Type Ia and core-collapse “yields” as a function of Tcond for each input refractory element, [X/H], in the KPM. Bottom: fcc computed from the q-values using Equation (3), as a function of Tcond. We find a strong positive trend between fcc and Tcond consistent with underlying nucleosynthetic yield patterns shown in the top panel. [Mg/H] appears as an outlier but is fixed at fcc = 1 in the KPM. Data are not separated by survey here for visual clarity.
Other Images in This Article
Show More
Copyright and Terms & Conditions
© 2026. The Author(s). Published by the American Astronomical Society.
Copyright ©
2026 Astronomy Image Explorer. All Rights Reserved.