Image Details
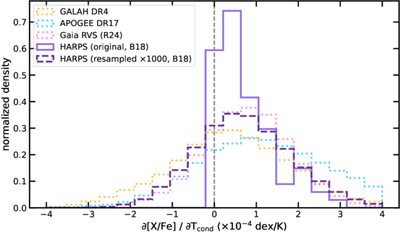
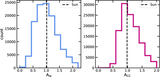
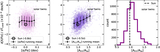
Caption: Figure 3.
Distributions of Tcond slopes for solar analogs across different surveys. The HARPS sample from B18 is shown in solid purple, with resampled slopes using mean abundance uncertainties from GALAH, APOGEE, and Gaia RVS shown in dashed purple. GALAH, APOGEE, and Gaia RVS distributions are shown in orange, blue, and pink, respectively. Injecting larger uncertainties into the HARPS sample broadens the slope distribution and increases the fraction of stars with Tcond slopes <0, making the Sun appear less anomalous (though still relatively refractory depleted) and more consistent with the three lower resolution surveys.
Other Images in This Article
Show More
Copyright and Terms & Conditions
© 2026. The Author(s). Published by the American Astronomical Society.