Image Details
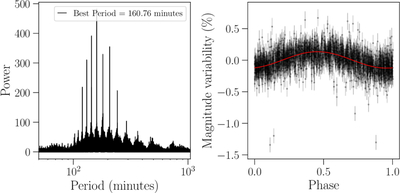
Caption: Figure 14.
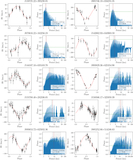
Left: the power spectrum from Lomb–Scargle periodogram of the ZTF light curve of Gaia DR3 4319799701688937600. Right: the phase-folded ZTF light curve is shown along with the best-fit sinusoidal model showing clear periodic variability.
Other Images in This Article
Show More
Copyright and Terms & Conditions
© 2026. The Author(s). Published by the American Astronomical Society.
Copyright ©
2026 Astronomy Image Explorer. All Rights Reserved.