Image Details
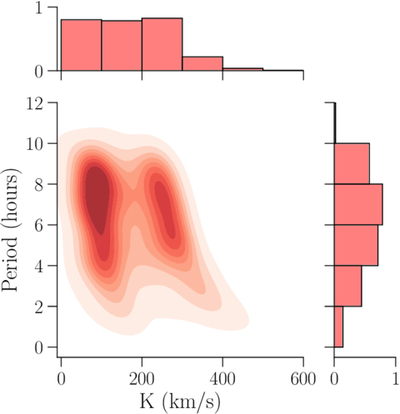
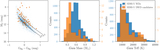
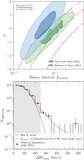
Caption: Figure 11.
Predicted period and RV semiamplitude distribution for the Type Ia progenitors in the simulated SDSS-V WD sample. The histograms in the top and right plots show the distribution of RV semiamplitude, K, and the period for Type Ia progenitors. We find that Type Ia progenitors are concentrated toward longer periods and thus relatively modest RV semiamplitudes, making them difficult to identify.
Other Images in This Article
Show More
Copyright and Terms & Conditions
© 2026. The Author(s). Published by the American Astronomical Society.
Copyright ©
2026 Astronomy Image Explorer. All Rights Reserved.