Image Details
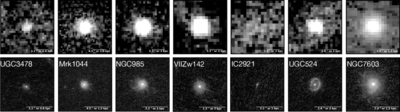
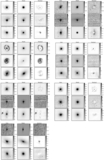
Caption: Figure 1.
Cutout images of the Swift/UVOT data in the UVM2 band (top) and the HST UVIS data in the F225W band (bottom) for each source in the sample. These two filters have approximately the same central wavelength (2246.43 Å and 2357.65 Å, respectively), and the scale of each image is identical. The increased resolving power of the HST data reveals extended features that are not visible in the Swift/UVOT data. The difference in the UV magnitude of the central point source, as measured from the Swift and HST data, increases from left to right and is listed in Table 2.
Other Images in This Article
Show More
Copyright and Terms & Conditions
© 2026. The Author(s). Published by the American Astronomical Society.
Copyright ©
2026 Astronomy Image Explorer. All Rights Reserved.