Image Details
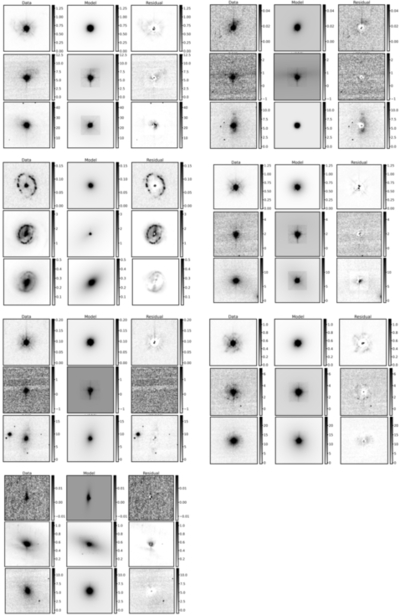
Caption: Figure B2.
Results of the fits from the GALFIT analysis. Each source is grouped individually with a 3 × 3 grid showing the data, model, and residual (from left to right) for each filter. Each row shows a different filter, with F225W on the top, F435W in the middle, and F814W on the bottom. The sources are organized as follows: NGC7603 (upper left), UGC3478 (upper right), UGC524 (second left), Mrk1044 (second right), NGC985 (third left), VIIZw142 (third right), and IC 2921 (bottom left).
Other Images in This Article
Show More
Copyright and Terms & Conditions
© 2026. The Author(s). Published by the American Astronomical Society.
Copyright ©
2026 Astronomy Image Explorer. All Rights Reserved.