Image Details
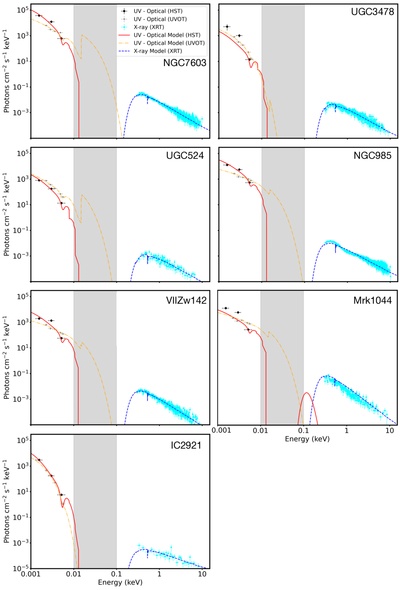
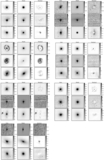
Caption: Figure 3.
The optical/UV SEDs and Swift/XRT data fit with the XSPEC models as described in Section 3.4. Black data points and the red line show the HST data and fit, while gray data points and the orange line show the Swift/UVOT data and fits from G24. The models fit to the HST data include a photoionization absorption component that was not included in G24. This component affects the emission in the EUV, which is unconstrained in both datasets (shown in in gray).
Other Images in This Article
Show More
Copyright and Terms & Conditions
© 2026. The Author(s). Published by the American Astronomical Society.
Copyright ©
2026 Astronomy Image Explorer. All Rights Reserved.