Image Details
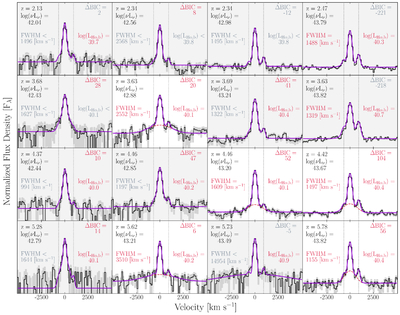
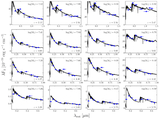
Caption: Figure 2.
Median Hα emission lines for our 16 stacks. Stacks increase in continuum luminosity from left to right, and increase in redshift from top to bottom. The total best-fit model is shown in purple for each stack, and a well-detected (>3σ) BL fit component is shown by the dashed red line. The ΔBIC, FWHM, and LHα,broad are given for each stack. Stacks that pass our three criteria for a detected BL, described in Section 4, have their ΔBIC, FWHM, and LHα,broad shown in red and a white background. Stacks that do not pass the BL identification criteria have a light gray background.
Other Images in This Article
Copyright and Terms & Conditions
© 2026. The Author(s). Published by the American Astronomical Society.
Copyright ©
2026 Astronomy Image Explorer. All Rights Reserved.