Image Details
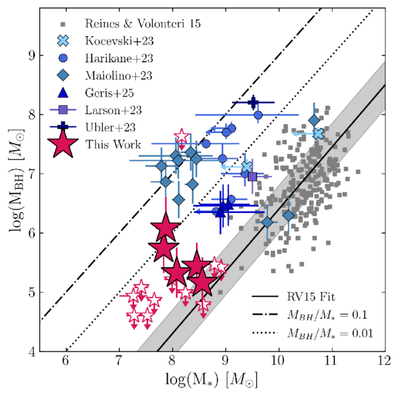
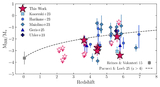
Caption: Figure 6.
BH mass as a function of stellar mass. Stacks with detected broad Hα emission are shown with red filled stars, and 3σ BH mass upper limits are shown with red open stars. The gray squares show local AGN from A. E. Reines & M. Volonteri (2015). Other JWST-detected BLAGN are shown: R. L. Larson et al. (2023, purple square), H. Übler et al. (2023, plus), Y. Harikane et al. (2023, circles), R. Maiolino et al. (2024a, diamonds), and D. D. Kocevski et al. (2023, crosses). Another stacking analysis, performed by S. Geris et al. (2026) in the JADES deep fields, is indicated with blue triangles; the median-stacked spectra in this work probe lower BH masses than the S. Geris et al. (2026) sample due to our increased sample size and use of upper limits. The MBH–M* relation derived by A. E. Reines & M. Volonteri (2015; low-z relation) is shown by the solid black line. We also show MBH/M* = 0.1 (dashed–dotted line) and MBH/M* = 0.01 (dashed line).
Other Images in This Article
Copyright and Terms & Conditions
© 2026. The Author(s). Published by the American Astronomical Society.