Image Details
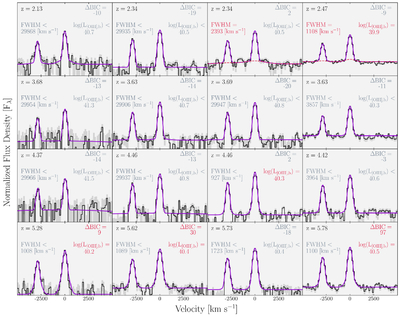
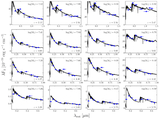
Caption: Figure 3.
Median [O III] emission lines for our 16 stacks. Stacks increase in continuum luminosity from left to right, and increase in redshift from top to bottom. The total best-fit model is shown in purple for each stack, and a well-detected (>3σ) BL fit component is shown by the dashed red line. The ΔBIC, FWHM, and LHα,broad are given for each stack. Stacks that pass our three criteria for a detected BL, described in Section 4, have their ΔBIC, FWHM, and LHα,broad shown in red. The lack of BL Hα detections indicates evidence for no outflows in these stacks. Stacks that do not pass the BL identification criteria have a light gray background.
Other Images in This Article
Copyright and Terms & Conditions
© 2026. The Author(s). Published by the American Astronomical Society.