Image Details
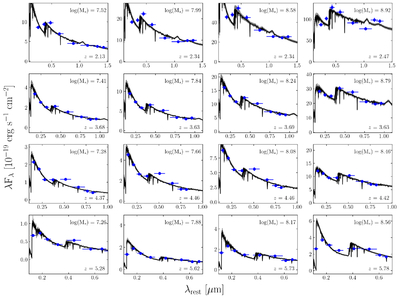
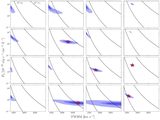
Caption: Figure 8.
λFλ vs. λrest for our 16 NIRCam+HST stacks. Blue points indicate median-stacked fluxes, and the best-fit SED is shown in black. Our stacking process is described in Section 3, and our stellar mass measurements are described in Section 3.1. The horizontal errors shown represent the filter widths.
Other Images in This Article
Copyright and Terms & Conditions
© 2026. The Author(s). Published by the American Astronomical Society.
Copyright ©
2026 Astronomy Image Explorer. All Rights Reserved.