Image Details
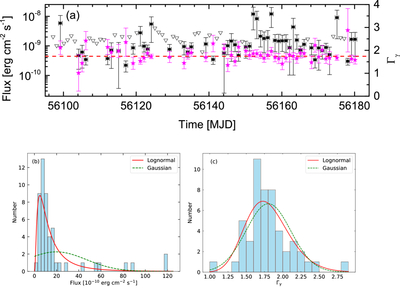
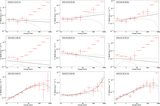
Caption: Figure 3.
Panel (a): the light curve (black solid squares) derived with a 1 day time bin in the 0.1–1000 GeV band, along with the curves of Γγ (magenta solid stars). The red horizontal dashed line represents the weighted average flux. If TS < 9, an upper limit of flux (black open triangles) is provided for that time bin. Panels (b) and (c): the histogram distributions of the flux and Γγ with the lognormal (red solid lines) and Gaussian (green dashed lines) fits, respectively. The values of flux and Γγ are consistent with the data presented in panel (a).
Other Images in This Article
Copyright and Terms & Conditions
© 2026. The Author(s). Published by the American Astronomical Society.
Copyright ©
2026 Astronomy Image Explorer. All Rights Reserved.