Image Details
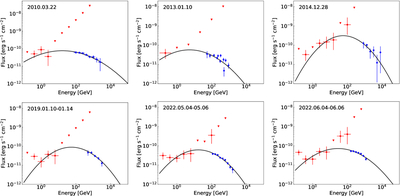
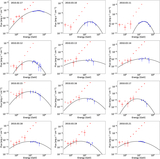
Caption: Figure 6.
The 18 GeV–TeV spectra with a rough fitting using the LP model (black solid lines). The GeV spectra (red symbols) for each panel are the same as those in Figure 4, while the TeV spectra (blue symbols) are taken from the literature. For the details of the TeV data, refer to Section 2.2.
Other Images in This Article
Copyright and Terms & Conditions
© 2026. The Author(s). Published by the American Astronomical Society.
Copyright ©
2026 Astronomy Image Explorer. All Rights Reserved.