Image Details
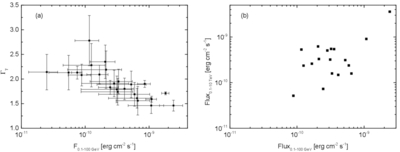
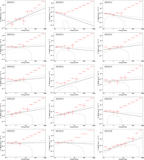
Caption: Figure 5.
Panel (a): Γγ as a function of the flux in the 0.1–100 GeV band for the 24 time-resolved spectra, as given in Table 1. Panel (b): F0.1−10 TeV versus F0.1−100 GeV for the 18 GeV–TeV spectra shown in Figure 6. The values of F0.1−100 GeV are taken from Table 1, while the F0.1−10 TeV values are derived through a rough fitting of the 18 TeV spectra using a simple PL function; see Section 3.4 for more details.
Other Images in This Article
Copyright and Terms & Conditions
© 2026. The Author(s). Published by the American Astronomical Society.
Copyright ©
2026 Astronomy Image Explorer. All Rights Reserved.