Image Details
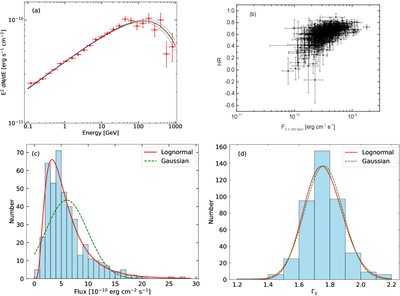
Caption: Figure 1.
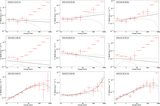
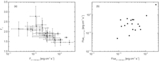
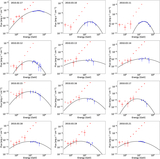
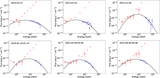
Panel (a): the 17 yr integrated spectrum of Mrk 421 obtained by Fermi-LAT observations in the 0.1–1000 GeV band. The black solid line and gray dashed lines represent the spectral fitting result and the corresponding 1σ uncertainties, respectively. Panel (b): HR as a function of F0.1−100 GeV, where ﹩{\rm{HR}}=\frac{{F}_{1-100\,{\rm{GeV}}}-{F}_{0.1-1\,{\rm{GeV}}}}{{F}_{1-100\,{\rm{GeV}}}+{F}_{0.1-1\,{\rm{GeV}}}}﹩ and F0.1−100 GeV = F0.1−1 GeV + F1−100 GeV. The values of F0.1−1 GeV and F1−100 GeV are derived using a 14 day time bin, consistent with the data in panels (b) and (c) of Figure 2. Panels (c) and (d): the histogram distributions of the flux and Γγ with the lognormal (red solid lines) and Gaussian (green dashed lines) fits, respectively. The values of the flux and Γγ are derived from the 17 yr Fermi-LAT observational data within the 0.1–1000 GeV band, using a 14 day time bin, consistent with the data in panels (a) and (e) of Figure 2.
(The data used to create this figure are available in the online article.)
(The data used to create this figure are available.)
Other Images in This Article
Copyright and Terms & Conditions
© 2026. The Author(s). Published by the American Astronomical Society.