Image Details
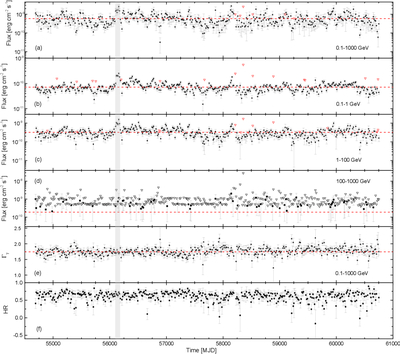
Caption: Figure 2.
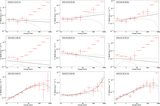
The 17 yr long-term light curves, derived with a 14 day time bin, in the 0.1–1000 GeV band (panel (a)), 0.1–1 GeV band (panel (b)), 1–100 GeV band (panel (c)), and 100–1000 GeV band (panel (d)), as well as the curves of Γγ (panel (e)) and HR (panel (f)). The red horizontal dashed lines represent the average values. If TS < 9, an upper limit of flux (red or black open triangles) is provided for that time bin. The gray shaded area indicates the time interval during which the light curve on a daily timescale is derived, as depicted in Figure 3.
Other Images in This Article
Copyright and Terms & Conditions
© 2026. The Author(s). Published by the American Astronomical Society.
Copyright ©
2026 Astronomy Image Explorer. All Rights Reserved.