Image Details
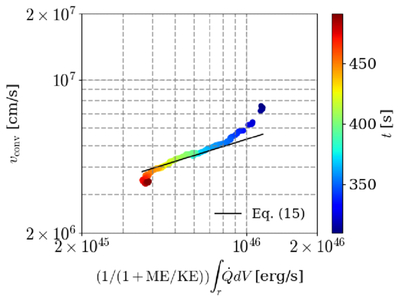
Caption: Figure 4.
Comparison of our predicted convective energy flux based on the energy partition between convective and Poynting fluxes (Equation (15)) with simulation data. The convective velocity vconv in the O shell is shown on the vertical axis against the right-hand side of Equation (15) on a log-log scale. The color of each point indicates the corresponding time in the simulation during the quasi-steady-state phase (t = 300–480 s). The black line represents a power law with an index of 1/3.
Other Images in This Article
Copyright and Terms & Conditions
© 2026. The Author(s). Published by the American Astronomical Society.
Copyright ©
2026 Astronomy Image Explorer. All Rights Reserved.