Image Details
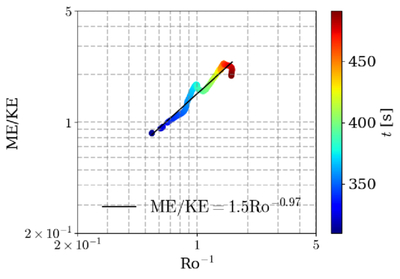
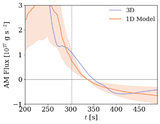
Caption: Figure 3.
The horizontal axis shows the inverse of the Rossby number, and the vertical axis shows the ratio between the magnetic and kinetic energy. The color of each point indicates the corresponding time in the simulation that satisfies the quasi-steady state condition, as shown by the rainbow colorbar (t = 300–480 s; Equation (10)). The black solid line represents the best fit to the quantities taken from the 3D MHD simulation.
Other Images in This Article
Copyright and Terms & Conditions
© 2026. The Author(s). Published by the American Astronomical Society.
Copyright ©
2026 Astronomy Image Explorer. All Rights Reserved.