Image Details
Caption: Figure 5.
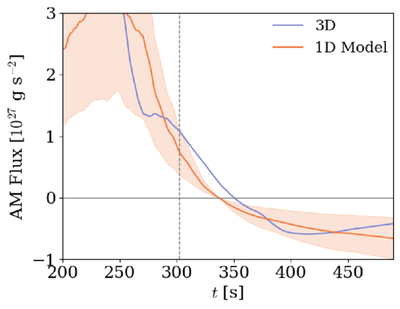
The temporal evolution of the angular momentum flux due to the Maxwell stress (Equation (3)) in the 3D MHD simulation (blue line). Our 1D model, given by Equation (20) is shown by the orange line. The orange shaded region represents the uncertainty of the 1D model, accounting for the combined standard deviation of the model parameters. The flux is measured at the middle of the O shell (4500 km). The gray dashed line indicates the time at which the convective dynamo in the O shell reaches the quasi-steady state. After 340 s and 350 s for the 1D and 3D models, respectively, the angular momentum is transported inward, coinciding with the timing when the rotation rate begins to spin up (see Figure 1(a)).
Other Images in This Article
Copyright and Terms & Conditions
© 2026. The Author(s). Published by the American Astronomical Society.