Image Details
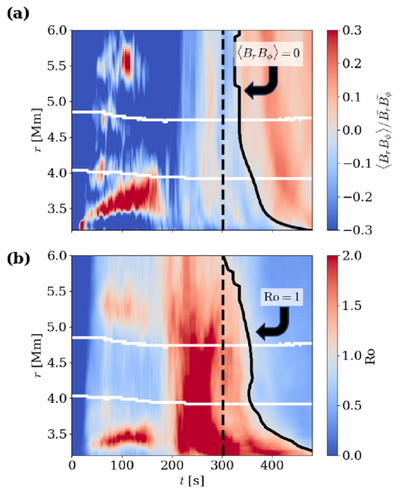
Caption: Figure 2.
Time–radius diagrams of (a) the correlation between Br and Bϕ (Equation (11)), and (b) the Rossby number Ro, are shown using a cool-to-warm color scale (color bars are shown on the right). The vertical axis indicates radius, and the horizontal axis denotes time. The O shell (the region between two white lines) reaches the quasi-steady states in the convective dynamo at ≈300 s (black dashed line). The black solid line in panel (a) indicates the region where the correlation changes its sign. The black solid line in panel (b) displays the region where Rossby number crosses unity.
Other Images in This Article
Copyright and Terms & Conditions
© 2026. The Author(s). Published by the American Astronomical Society.
Copyright ©
2026 Astronomy Image Explorer. All Rights Reserved.