Image Details
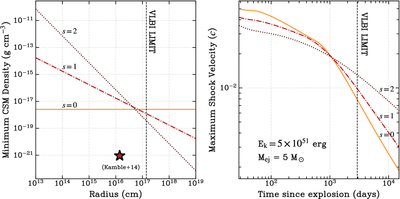
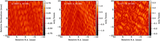
Caption: Figure 6.
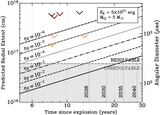
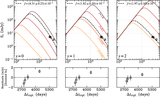
Left panel: inferred minimum CSM density profiles required to decelerate a shockwave launched on UTC 2012 February 29.5 and remain unresolved by the time of our VLBI observations 8 yr post-explosion. We assume that the kinetic energy and ejected mass released during the explosion is Ek = 5 × 1051 erg and Mej = 5 M⊙ (S. B. Pandey et al. 2021). We plot the scaling for varying CSM density profiles (ρcsm ∝ r−s, s = 0, 1, 2). With the assumed CSM profile, all profiles converge to a shock radius of ﹩{R}_{{\rm{\max }}}=1.4\times 1{0}^{17}\,{\rm{cm}}﹩ at Δtexpl. = 2925 days. The inferred density at r = 1.4 × 1014 cm from A. Kamble et al. (2014) is indicated with a red star, highlighting the required difference in density between the polar axis and equatorial axis. Right panel: evolution of the forward shock velocity as a function of time for a shockwave interacting with the associated density profile. In both cases, we plot the corresponding radius and time stamp from Epoch 2 in Table 2 as a dashed vertical line.
Other Images in This Article

Copyright and Terms & Conditions
© 2026. The Author(s). Published by the American Astronomical Society.