Image Details
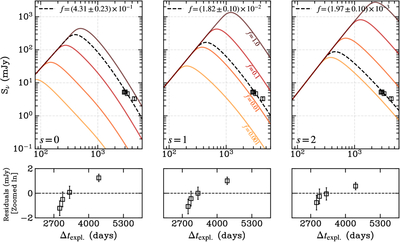
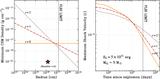
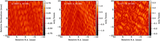
Caption: Figure 7.
Late-time modeled (SSA-only) flux evolution at ν = 4.93 GHz of a shockwave interacting with a torus-like CSM with density profiles characterized by a single power law, ρcsm ∝ r−s, as shown in Figure 6. From left to right, each panel corresponds to the flux evolution for s = 0, 1, and 2, highlighting how varying s alters the predicted flux evolution. We plot the late-time VLBI flux measurements at 4.93 GHz from Table 4 as black squares. The best-fit model, corresponding to the required filling factor to scale the late-time fluxes, is indicated by a dashed black line. The maroon, red, orange, and yellow lines on each panel represent filling factors f = 1.0, 0.1, 0.01, and 0.001, respectively, as labeled in the middle panel. Residuals of each fit are provided in the lower panels, zoomed in around the time of our observations. The figure assumes Ek = 5 × 1051 erg, Mej = 5 M⊙, DL = 23.5 Mpc, vw = 1000 km s−1, α = 1, ϵB = 0.1, and p = 3.
Other Images in This Article

Copyright and Terms & Conditions
© 2026. The Author(s). Published by the American Astronomical Society.