Image Details
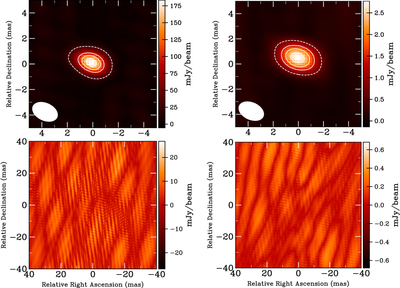
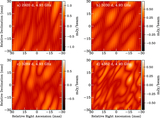
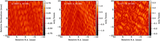
Caption: Figure 8.
Images of J1303−1051 (left panels) and SN 2012au (right panels), showing the final clean images (top row) and residuals (bottom row) after combining epochs 1, 4, and 5 at 4.93 GHz. The 5σ contour is dashed; solid contours are at 50%, 70%, and 90% of the peak. The color scale is in mJy beam−1, and the synthesized beam is shown in the lower-left of each clean image. Residuals are saturated to ±5σ to highlight systematic calibration errors common to both datasets.
Other Images in This Article
Copyright and Terms & Conditions
© 2026. The Author(s). Published by the American Astronomical Society.
Copyright ©
2026 Astronomy Image Explorer. All Rights Reserved.