Image Details
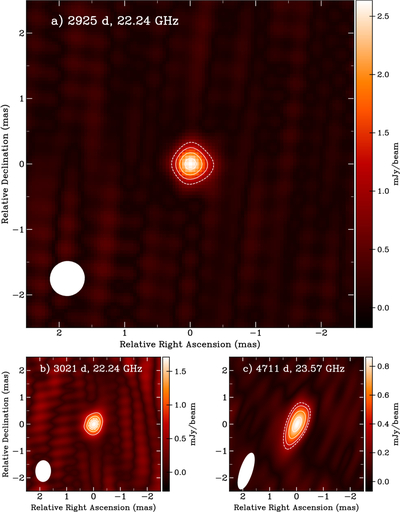
Caption: Figure 1.
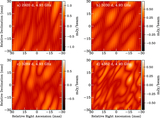
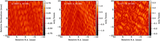
Cleaned K-band images of SN 2012au obtained with the EVN (panels (a) and (b)), and VLBA (panel (c)). Note that 5σ contours are indicated by the dashed line, where σ is the rms of the image residuals. Solid contours are drawn at 50%, 70%, and 90% of the peak flux. The color scale is indicated in units of mJy beam–1, and the synthesized beam is shown as a white ellipse in the bottom left of each image. The label on each panel shows the time in days since the date of the original explosion (D. Milisavljevic et al. 2013) and the central observing frequency of these data. All images are centered on the peak flux of each image for visual clarity. We discuss the astrometry in Section 3.2. Panel “(a)” provides the most constraining upper limit on the diameter of the emitting region of d ≲ (1.6 ± 0.4) × 1017 cm.
Other Images in This Article

Copyright and Terms & Conditions
© 2026. The Author(s). Published by the American Astronomical Society.