Image Details
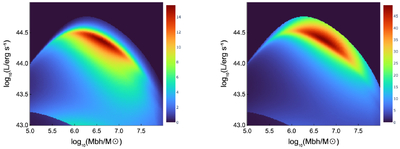
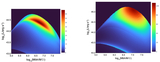
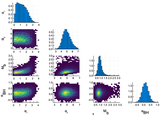
Caption: Figure 5.
The total (full + partial) event rate density in the ﹩\mathrm{log}{M}_{{\rm{BH}}}\times \mathrm{log}{L}_{{\rm{peak}}}﹩ plane for flux-limited samples. Both plots have αBH = 0, but the one in the left panel utilizes a Salpeter IMF mass function, cut off at 1 M⊙, i.e., α1 = 2.35, α2 = 4, and Mb = 1 M⊙, whereas the one in the right panel has no cutoff: α1 = α2 = 2.35. Rates (arbitrary units) are shown on a linear scale calibrated by the color bar.
Other Images in This Article

Copyright and Terms & Conditions
© 2026. The Author(s). Published by the American Astronomical Society.
Copyright ©
2026 Astronomy Image Explorer. All Rights Reserved.