Image Details
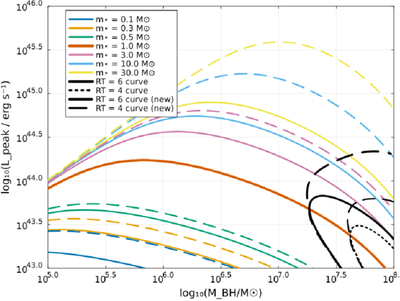
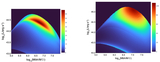
Caption: Figure 2.
Luminosities of full disruptions with stellar masses M* = 0.1, 0.3, 0.5, 1, 3, 10, 30 M⊙ as functions of MBH. Solid lines are calculated using the single power-law mass–radius relation, and dashed lines are calculated from the modified one. Also shown are the curves of luminosity our model would predict for RT = 6rg and RT = 4rg; extreme TDEs occur when 4rg < rp < 6rg (T. Ryu et al. 2023a); direct capture ensues when rp < 4rg (an exact result for Schwarzschild spacetime, the angle-averaged result for Kerr; J. Krolik et al. 2020). The luminosities of partial disruptions of a given M* form a family lying below the curve for a full disruption of such a star.
Other Images in This Article

Copyright and Terms & Conditions
© 2026. The Author(s). Published by the American Astronomical Society.