Image Details
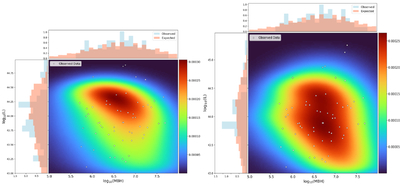
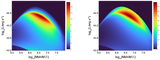
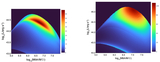
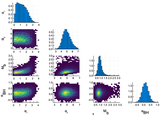
Caption: Figure 7.
The pdf for the best-fit parameters when we use the original MAMS mass–radius relation and the subsample of 57 data points (left) and the revised mass–radius relation with the sample of 59 data points (right). Note the wider range of luminosities shown in the right panel. To account for observational errors, we smooth the pdf with Gaussians of width ﹩{\sigma }_{{\mathrm{log}}_{10}({M}_{{\rm{BH}}})}=0.5﹩ and ﹩{\sigma }_{{\mathrm{log}}_{10}(L)}=0.1﹩. The value of the pdf is represented by color contours calibrated by the linear color scale shown to the right of the plot. The observed data points of our subsample (without error bars) are marked by small circles. The histogram on top of the color contour plots shows the 1D distribution of black hole masses, while the one on the left of the plot gives the 1D distribution of the luminosities.
Other Images in This Article

Copyright and Terms & Conditions
© 2026. The Author(s). Published by the American Astronomical Society.