Image Details
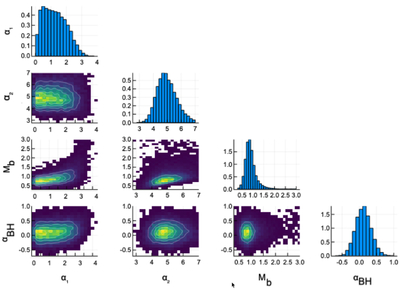
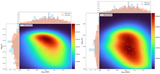
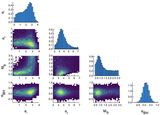
Caption: Figure 10.
A triangle diagram illustrating the parameter distribution for the sample of 59 TDEs when a two-power-law mass–radius relation is used. The underlying MCMC sampling had 50,000 steps. The color plots show the 2D marginalized distributions, and the histograms show the 1D marginalized distribution of the different parameters. Much like the parameter distributions based on the sample of 57 TDEs and a single power-law mass–radius relation, αBH ≃ 0, nearly independent of all other parameters. Similarly, the weak positive correlations between Mb and α1,2 persist. Relative to the other analysis, massive stars are somewhat more strongly suppressed: larger values of α2 are favored.
Other Images in This Article

Copyright and Terms & Conditions
© 2026. The Author(s). Published by the American Astronomical Society.