Image Details
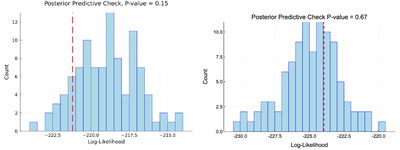
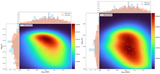
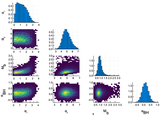
Caption: Figure 8.
The distribution of likelihoods for the best-fit parameters derived from 100 synthetic datasets constructed in the p-value procedure (blue histogram) compared to the likelihood of the actual data’s best-fit parameters (red vertical line), for the single power-law mass–radius relation (left) and the modified mass–radius relation (right). The likelihood of the observed data is better than the likelihood obtained in 15% of the synthetic datasets for the single power-law model and is better than obtained in 67% of the synthetic datasets for the modified mass–radius relation.
Other Images in This Article

Copyright and Terms & Conditions
© 2026. The Author(s). Published by the American Astronomical Society.
Copyright ©
2026 Astronomy Image Explorer. All Rights Reserved.