Image Details
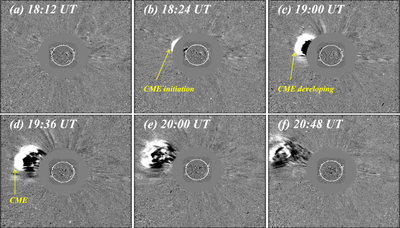
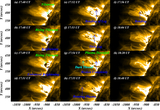
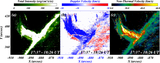
Caption: Figure 11.
The evolution of CME, as observed by the C2 coronagraph of LASCO. The CME appears around 18:24 UT, as indicated by the yellow arrow in panel (b). Further, the CME evolves with time as displayed in panels (d)–(f).
Other Images in This Article
Show More
Copyright and Terms & Conditions
© 2026. The Author(s). Published by the American Astronomical Society.
Copyright ©
2026 Astronomy Image Explorer. All Rights Reserved.