Image Details
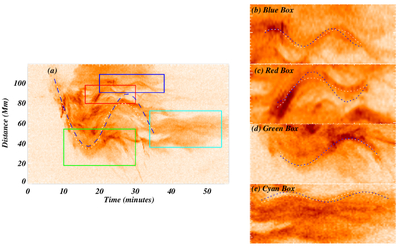
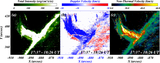
Caption: Figure 8.
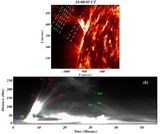
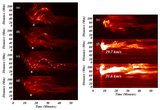
The TD image in panel (a) shows the transverse oscillation, and this TD image corresponds to panel (c) of Figure 7. The main oscillation is tracked manually (white-dashed path), and further fitted using Equation (2) (blue-dashed curve). Further, the individual oscillations are spotted in four different plasma threads, and the region of these oscillation are outlined by the blue, red, green, and cyan color boxes. The zoomed-in views of these boxes are shown in panels (b)–(e), respectively. Further, the transverse oscillations are tracked manually; see the white-dashed paths in panels (b)–(e). Next, the manually tracked paths are fitted using Equation (1), and the fitted curve is shown by the blue dotted lines in panels (b)–(e).
Other Images in This Article
Show More
Copyright and Terms & Conditions
© 2026. The Author(s). Published by the American Astronomical Society.